Textbook Elliott Wave Rally In Natural Gas June28 2016 by Ron Feinstein New Wave Forecasting

Textbook Elliott Wave Rally In Natural Gas June28 2016 by Ron Feinstein New Wave Forecasting

The back bone of the Elliott Wave Principle as applied to forecasting markets is the five wave impulse sequence.  Sometimes we get lucky and I spot one.   These are the exact charts and posts my subscribers received in REAL TIME!
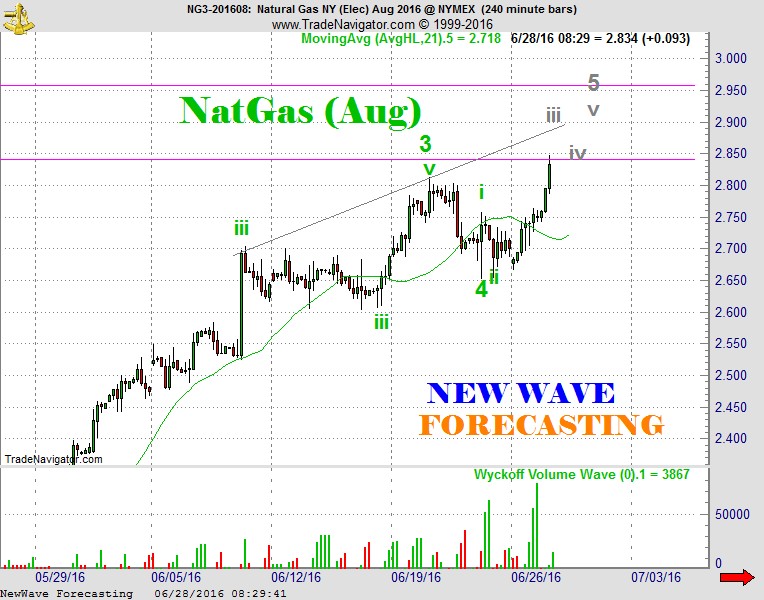
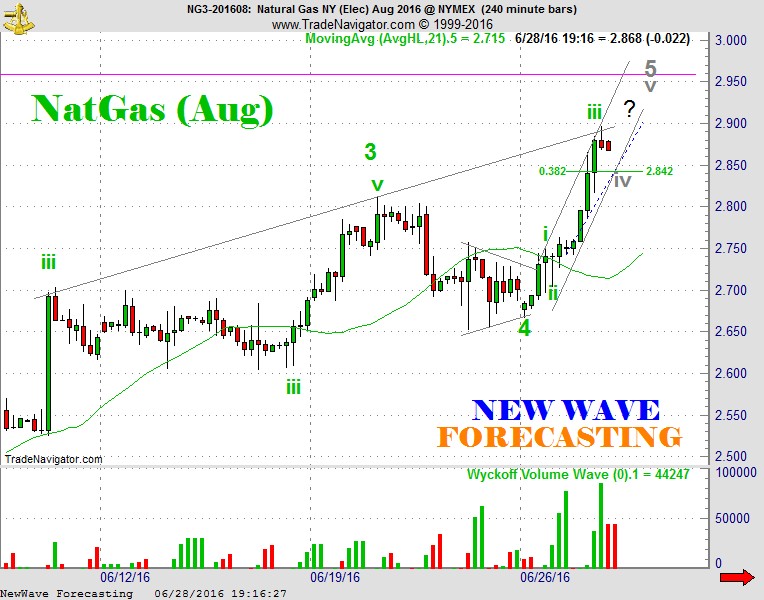
When I first assessed the situation it seemed only reasonable that the rising resistance line was going to come into play and may be the limiting factor to the five wave advance I was forecasting so this post went out at 7:30 AM CDT with prices at 2.835.  “There ought to be a pair of 3-4’s coming on the way to the next wave 5 top” with a broad target zone of 2.88-2.95.

ng06282016


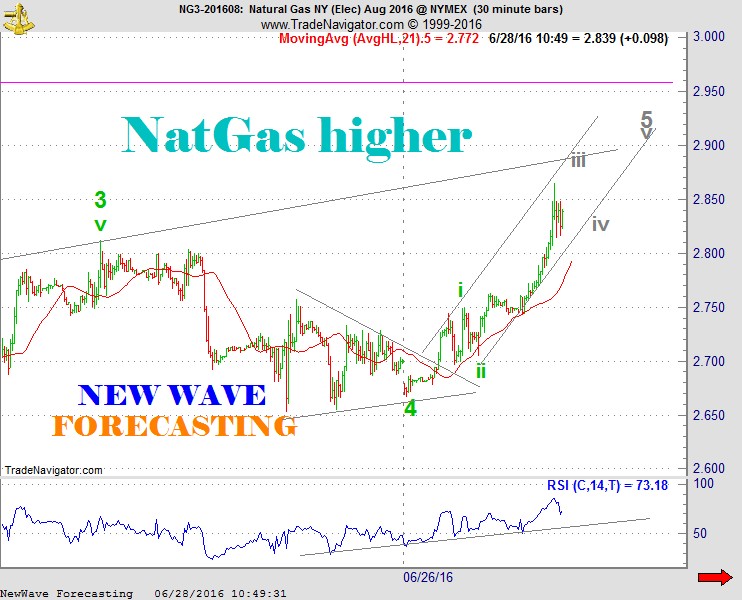
At about 9:50 prices were at 2.839  following a run up to 2.87.  I drilled down time frames and refined the road map a bit with an Elliott Channel but “the forecast remains the same-higher still”.

ng06282016a


At about 1:15 the market was trading 2.883 and I posted  “The market is overbought and it hit the rising resistance line so perhaps wave iii has peaked or might do so with a bull trap above 2.90.”  In addition “it is unlikely prices will trade below 2.82.”

ng06282016b


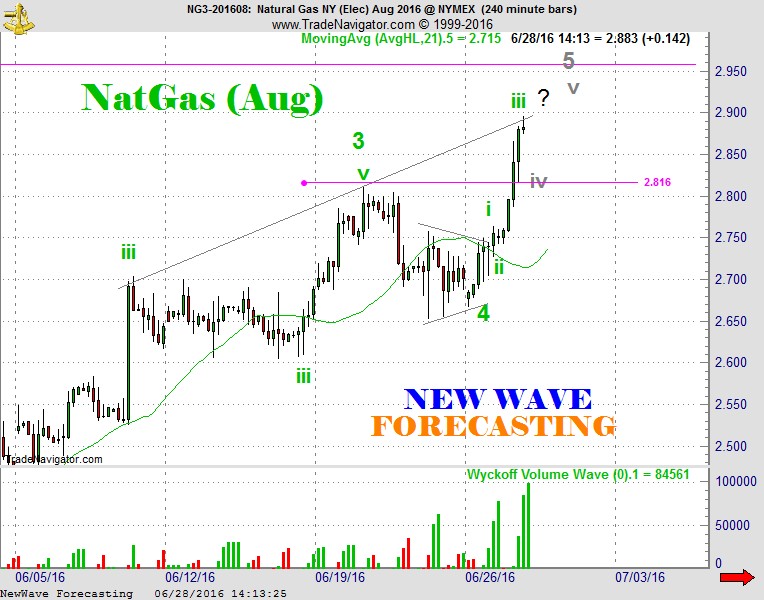
About 6:15 it seemed that everything was spot on and I shared “Ideally the small wave iv shakeout effort is now underway and might bear trap 2.85 prior to heading to a new high.”

ng06292016


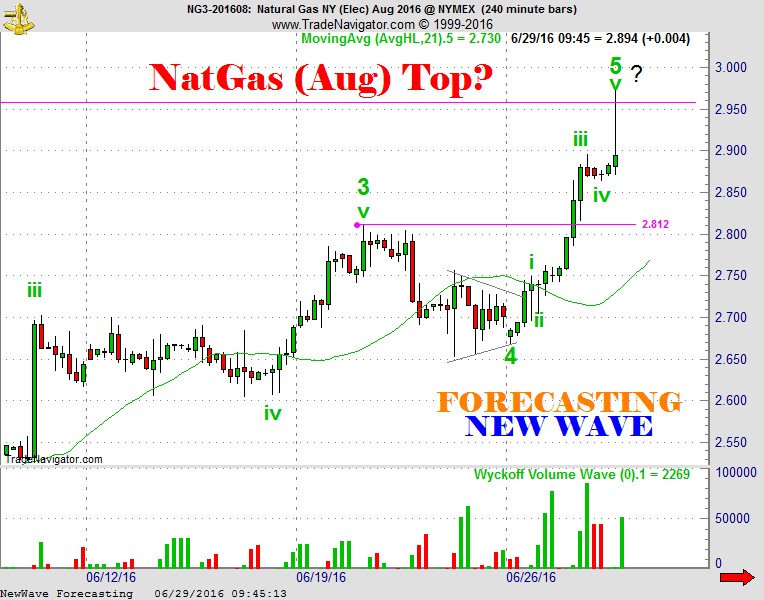
At 7:15 AM prices were trading 2.942 and I let out “The wave iv correction was a tiny triangle and if the location of wave 4 is correct we should be looking at the end of this run in front of tomorrow’s release. Falling below 2.895 would be the first indication of weakness.”


ng06292016a


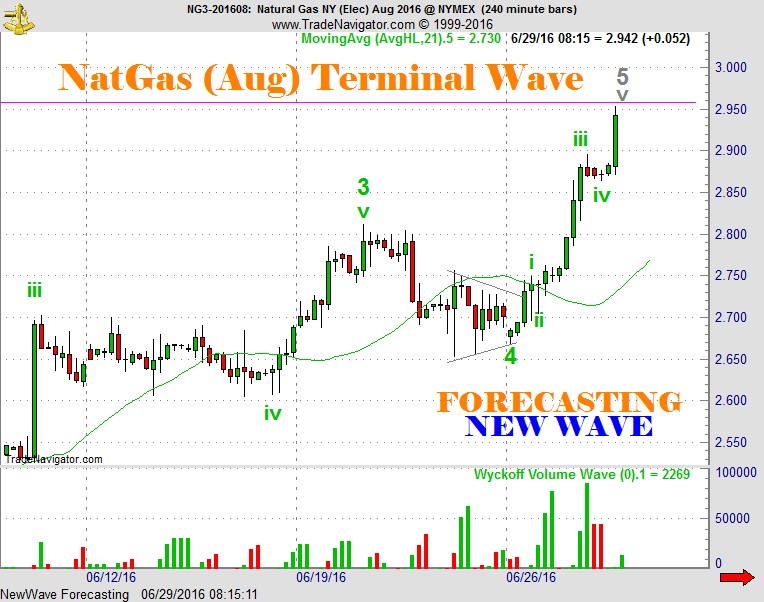
A little over an hour later at 8:45 after the market fell I called the top “but to confirm the move complete will be a breach of the wave 3 peak at 2.81 which might be a bit of a reach today.”.
ng06292016b


Submit a Comment

Your email address will not be published. Required fields are marked *

Risk Disclosure: Futures and forex trading contains substantial risk and is not for every investor. An investor could potentially lose all or more than the initial investment. Risk capital is money that can be lost without jeopardizing ones’ financial security or life style. Only risk capital should be used for trading and only those with sufficient risk capital should consider trading. Past performance is not necessarily indicative of future results. Hypothetical Performance Disclosure: Hypothetical performance results have many inherent limitations, some of which are described below. no representation is being made that any account will or is likely to achieve profits or losses similar to those shown; in fact, there are frequently sharp differences between hypothetical performance results and the actual results subsequently achieved by any particular trading program. One of the limitations of hypothetical performance results is that they are generally prepared with the benefit of hindsight. In addition, hypothetical trading does not involve financial risk, and no hypothetical trading record can completely account for the impact of financial risk of actual trading. for example, the ability to withstand losses or to adhere to a particular trading program in spite of trading losses are material points which can also adversely affect actual trading results. There are numerous other factors related to the markets in general or to the implementation of any specific trading program which cannot be fully accounted for in the preparation of hypothetical performance results and all which can adversely affect trading results.